Spread Pattern Test Procedure
N107964-UN-31OCT13
Spread Pattern Testing
-
N98681-UN-30MAY12Figure A—Test Course Setup
A - Collection Tray
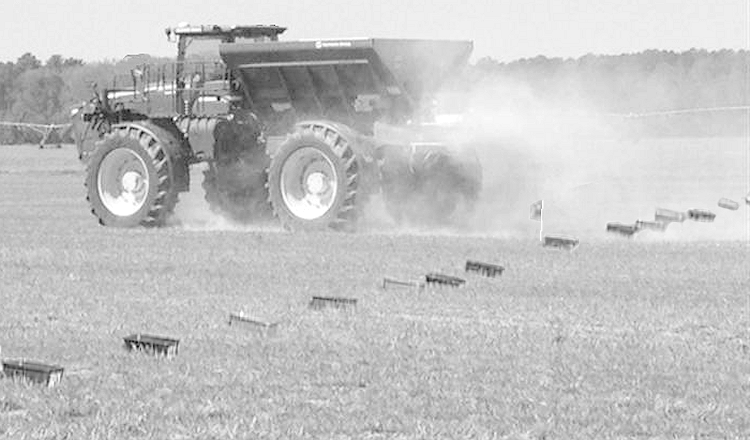
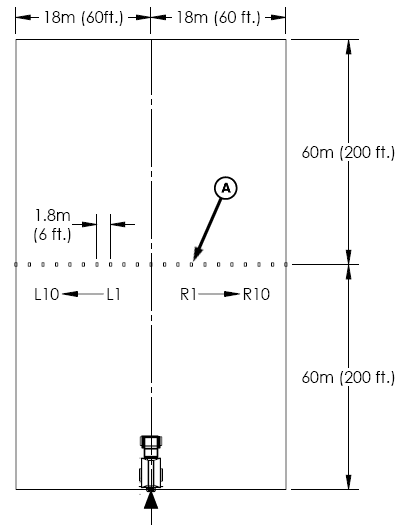
Select testing course (Figure A), measuring 37 m x 122 m (120 ft. x 400 ft.), should have a slope of less than two degrees.NOTE: All testing should be done when the wind velocity is less than 8.05 km (5 mph). If wind is present, testing must be done with spreader traveling parallel (within ± 15 degrees) to the wind direction.
-
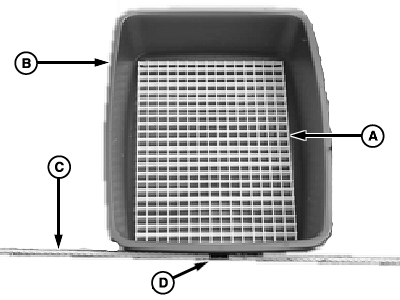
N98679-UN-24MAY12A - Plastic Grid
B - Collection Tray
C - Rope
D - Placement Indicator
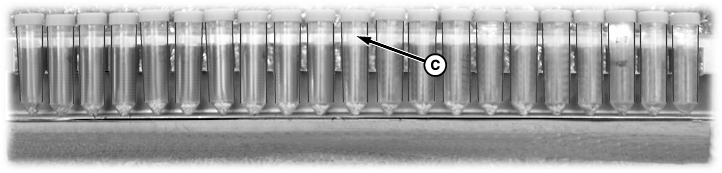
Insert a plastic grid (A) into each of the 21 collection trays (B). -
Position the 21 collection trays on six-foot 182.88 cm (6 ft.) centers with the longest dimension of the tray parallel to the direction of travel. Using provided rope (C) with indicator marks (D).
-
NOTE: Do not allow loaded spreader to sit for more than four hours prior to testing.
Position spreader at the beginning of the course so that vehicle will straddle center collection tray. Set gate opening based on desired rate/acre according to theoretical application charts supplied with each unit.
-
NOTE: Prior to driving the spreader through the test course, it should be driven at least 137 m (450 ft.) at spreader test speeds.
Each test must be repeated driving the same direction (not back and forth).
Drive spreader completely through course at normal operating speeds.
-
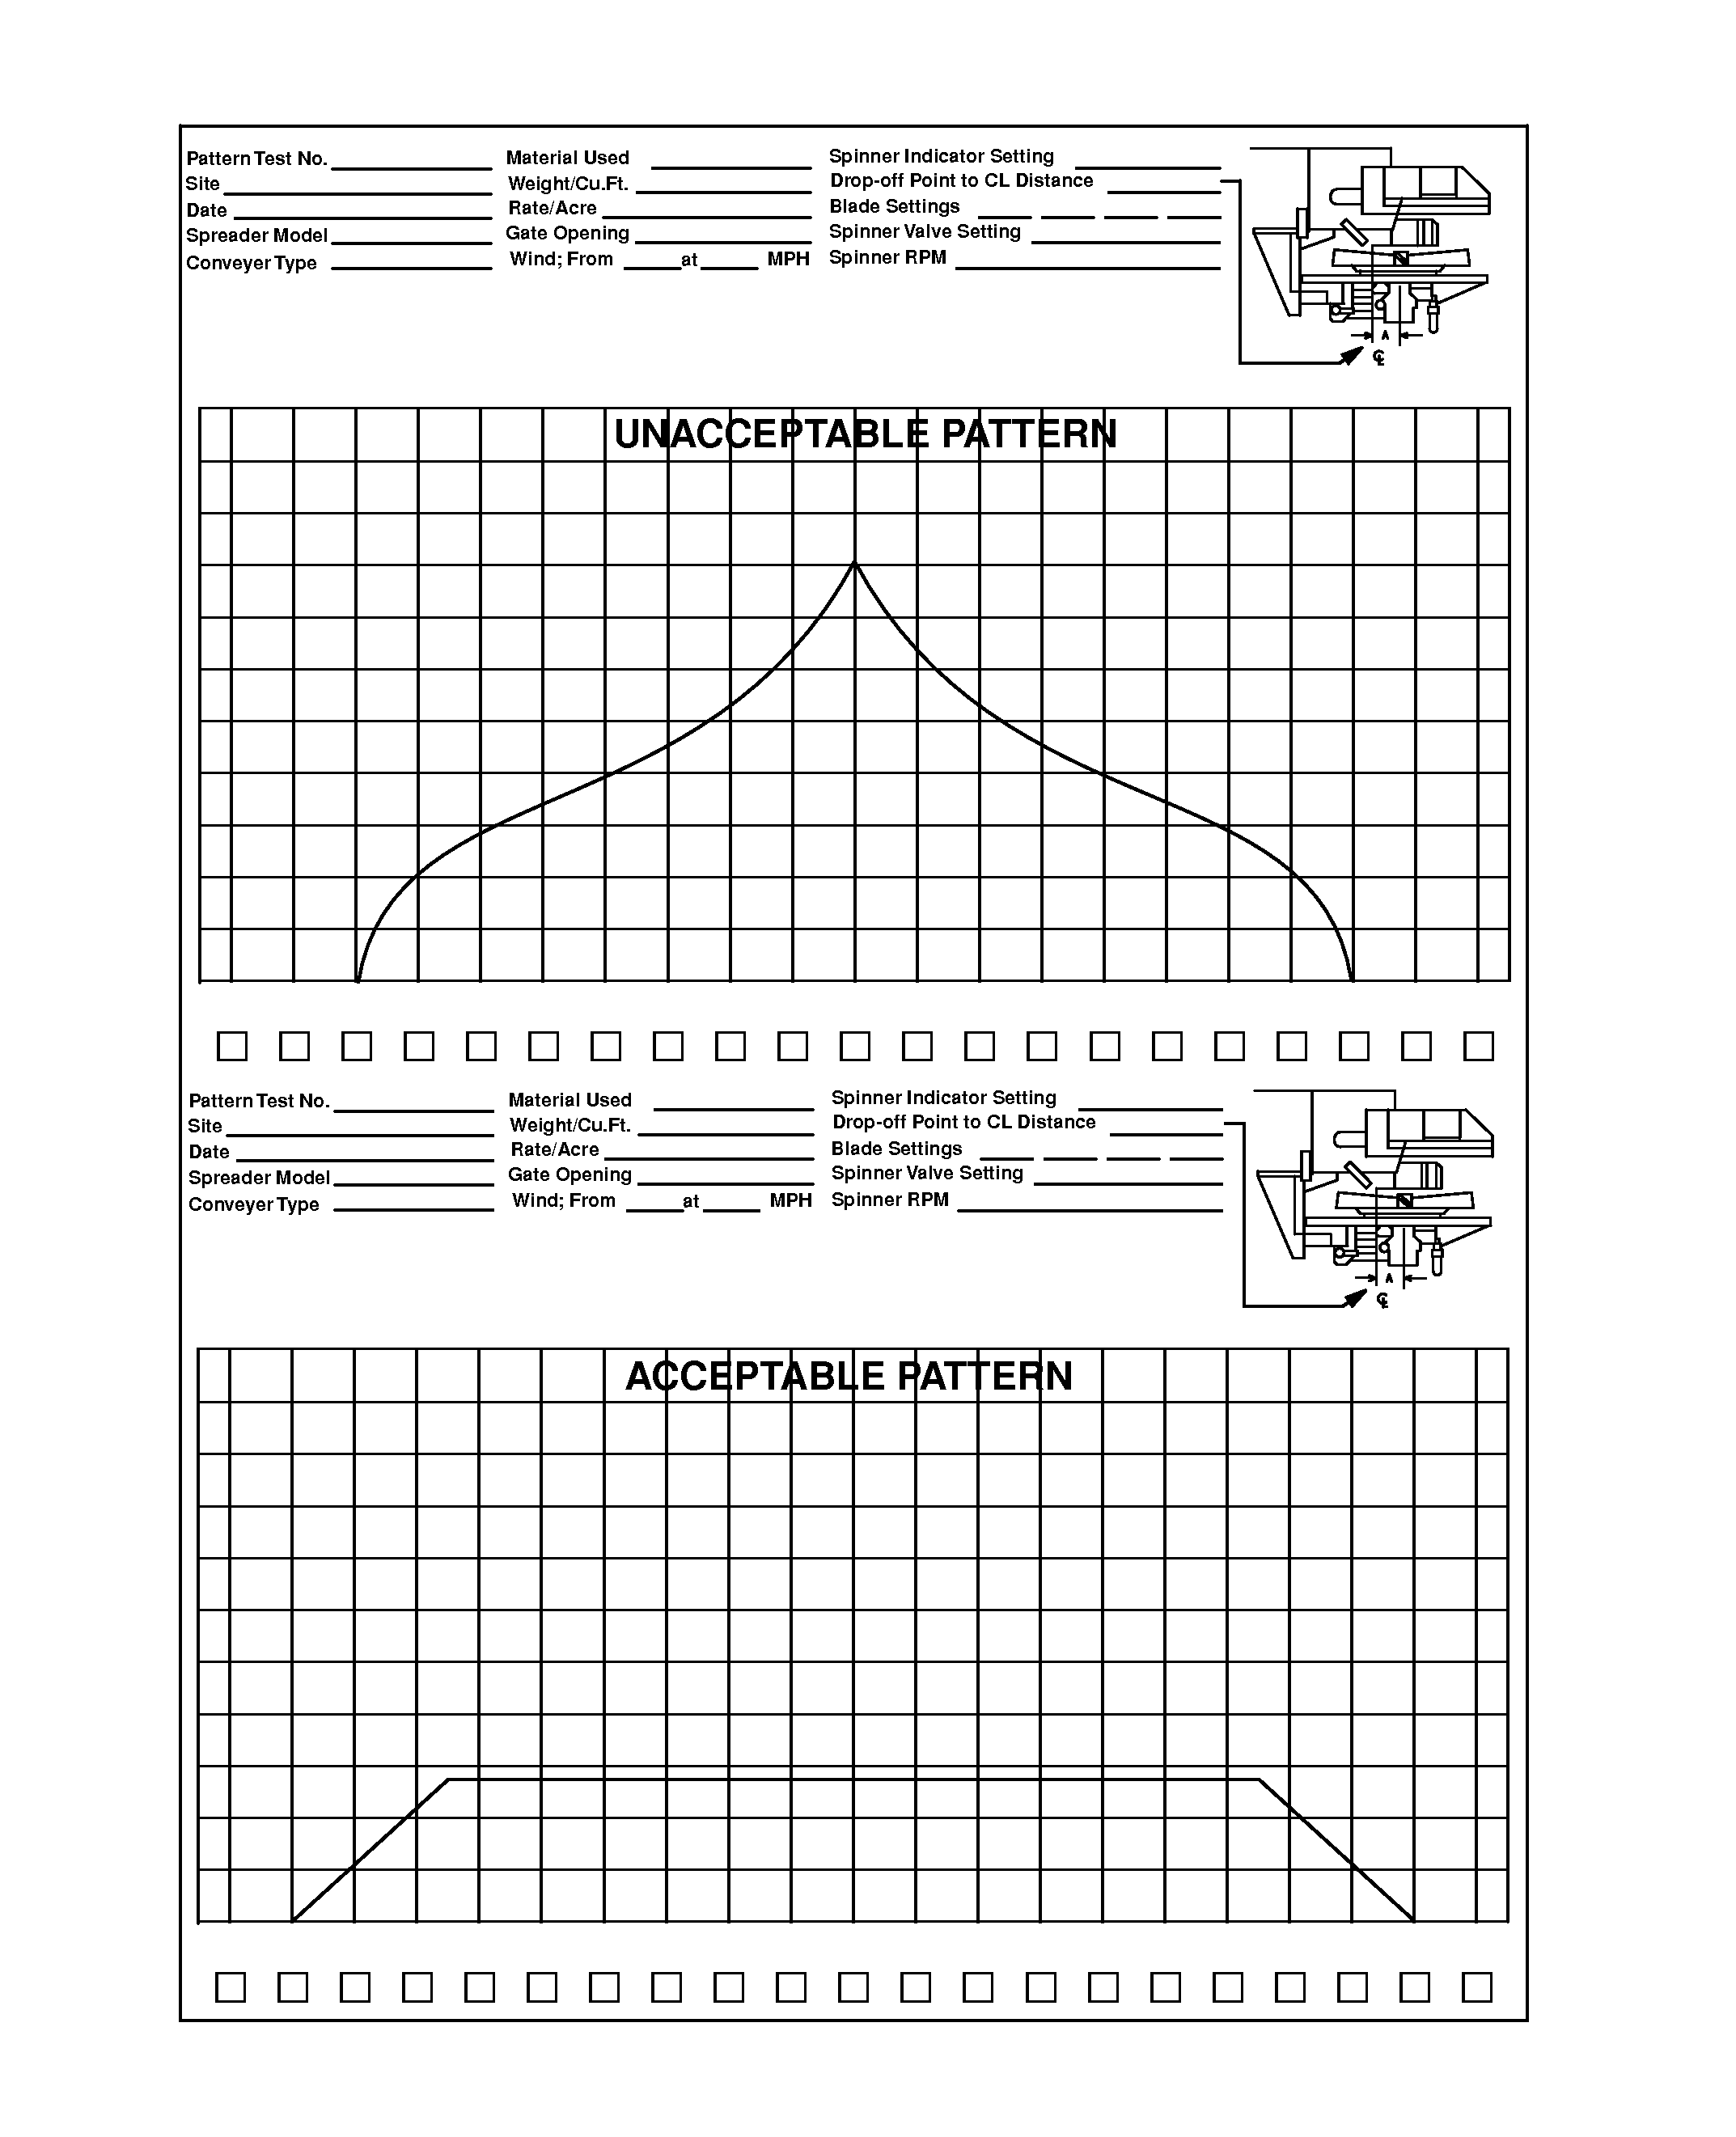
N97289-UN-05MAR12Figure B—Spread Chart Example
Using the data sheets supplied with the kit, document all spreader adjustments required. -
N98687-UN-01JUN12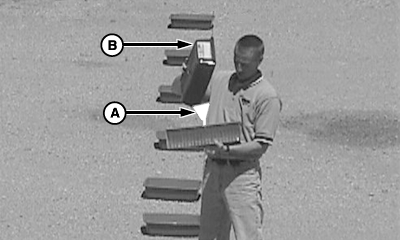
N98680-UN-23MAY12A - Funnel
B - Collection Tray
C - Test Tubes
Using the funnel (A), transfer the contents of each collection tray (B) into its corresponding test tube (C) beginning at one end of the trays and working towards the opposite end. -
Record the volume in each test tube in the box on the data sheet under the corresponding tray position. (Figure B).
NOTE: It is highly recommended that ONLY ONE ADJUSTMENT be made between test samples taken. If more than one adjustment is made, it will be difficult to determine which adjustment was responsible for the change in pattern shape.
DETERMINE DRIVING CENTERS
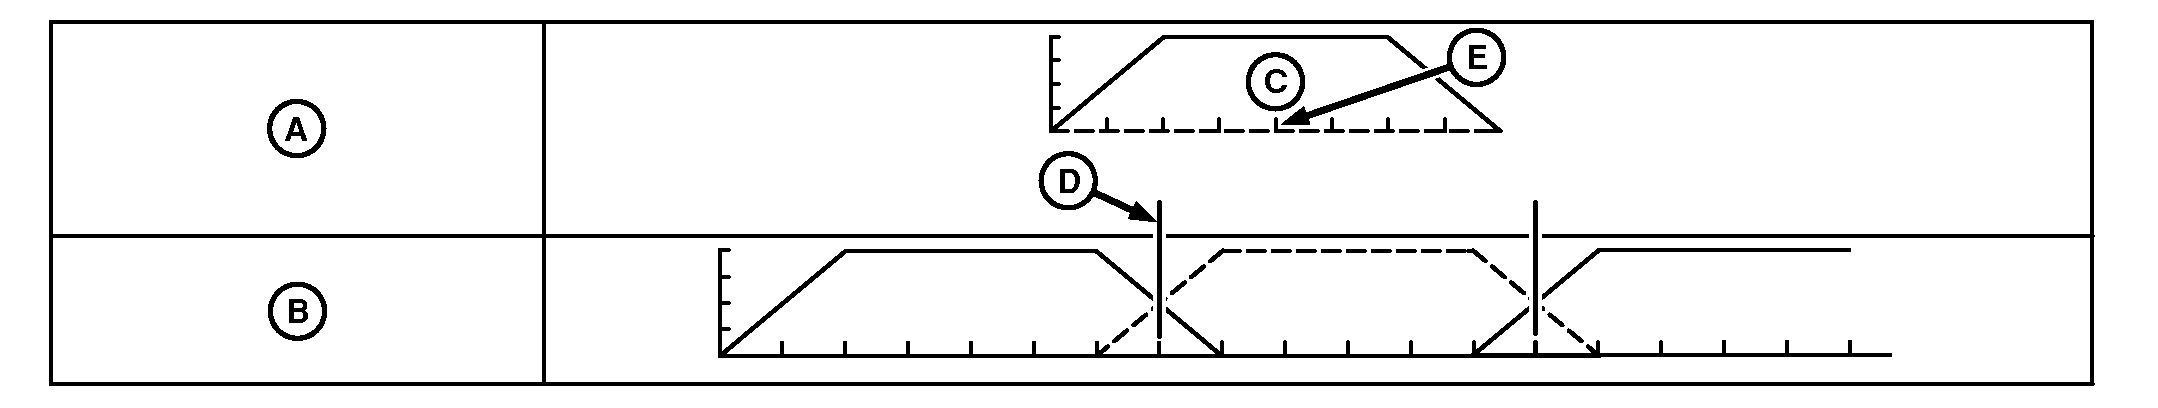
Once you attain a desirable pattern (Figure E), optimum-driving centers can be determined. To determine optimum driving centers (effective spead width), locate the points on both the left and right side of the pattern where the amount of material applied is half the amount at the center of the pattern. The distance between these two points represents the driving centers to be used (effective spread width).
When blended fertilizers are being applied, a visual inspection of the samples should be made to determine whether the blend within the effective spread width is consistent with the desired blend. If the blend is not consistent, a narrower overall spread width should be used and a new optimum driving center (effective spread width) should be determined.
Once the effective spread width has been established, change spread width in Spreadstar™ to match actual spread width.
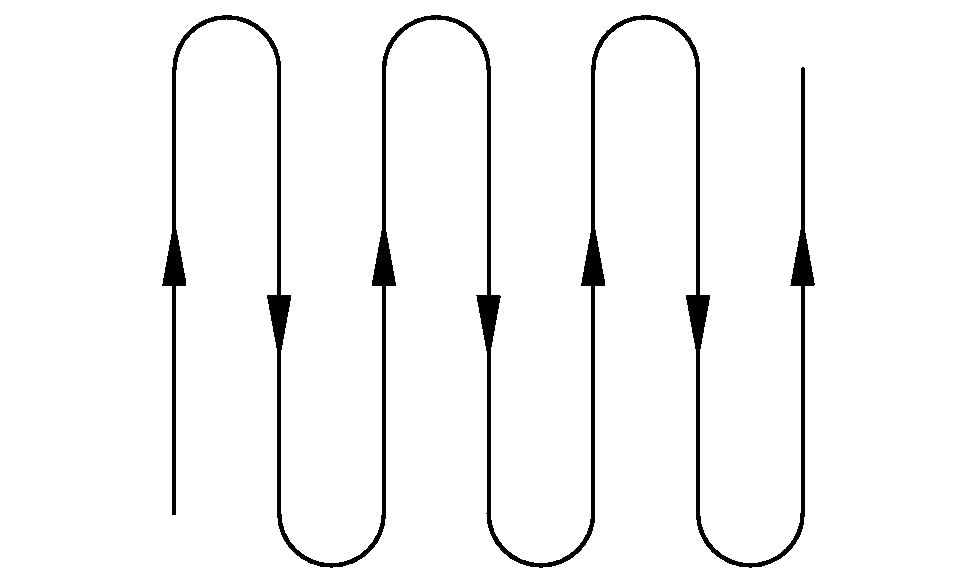
DRIVING METHODS
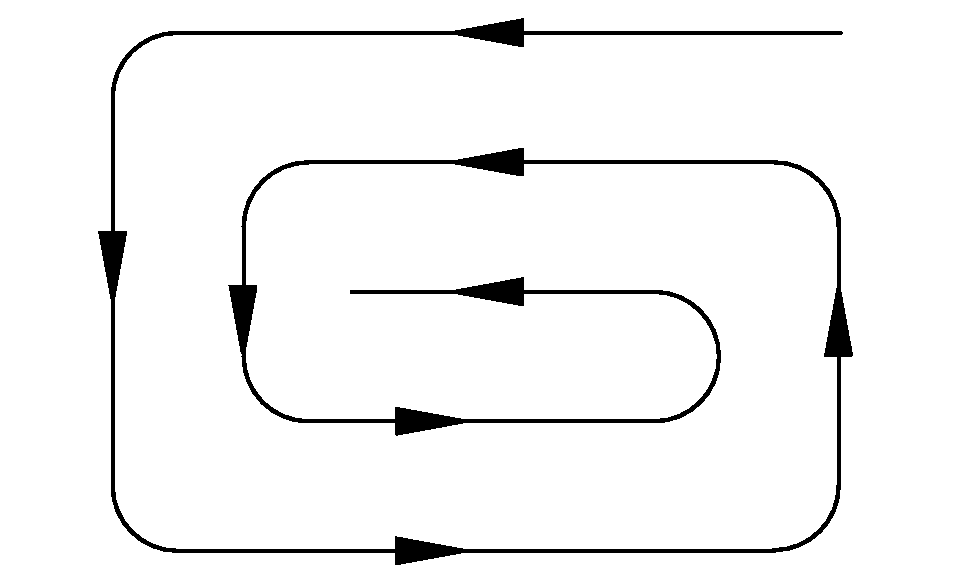
The perimeter (Figure C) and switch back (Figure D) driving methods are both acceptable.
NOTE: Utilizing the switch back method amplifies non-symmetrical patterns by blending right side on right and left side on left. The perimeter method compensates for nonsymmetrical patterns by blending the right side of the pattern with the left side of the adjacent pattern or vice versa.
N97292-UN-30MAY12
Figure E—Ideal Method
A - Flat Top Pattern
B - Ideal Pattern Overlap
C - Flat Top
D - Spread Width
E - Center of Pattern
N97290-UN-05MAR12
N97291-UN-05MAR12
|
Spreadstar is a trademark of Deere & Company |
OUO6092,00009BA-19-20150519 |