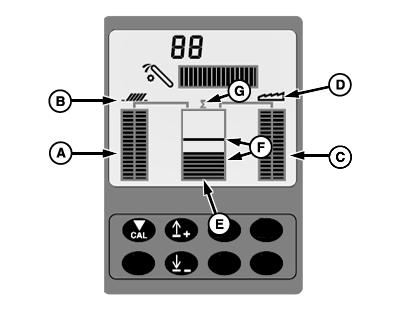
VisionTrak Performance MonitorGrain loss information is displayed by three vertical bar graphs. Shoe Loss Averaged shoe loss is shown by two adjacent vertical bar graphs (A). Shoe symbol (B) is displayed above bar graphs. Separator Loss Averaged separator loss is shown by two adjacent vertical bar graphs (C). Separator symbol (D) is displayed above bar graphs. Total Loss Total loss is shown on vertical bar graph (E) located in center of display. Two horizontal lines near center range indicate the calibrated normal range (F). Summation symbol (G) is displayed above bar graph. |
|
OUO6075,0000617 -19-28MAR07-1/1 |
