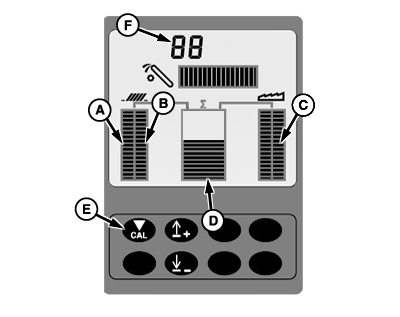
VisionTrak Performance Monitor (General Information)NOTE: VisionTrak is active when header is engaged and in some diagnostic modes. VisionTrak monitor checks grain loss by measuring a representative sample of losses over the cleaning shoe and through the separator. VisionTrak continuously monitors the machines performance to enable the operator to use maximum machine capacity. A change in loss rate is indicated by bar graphs. VisionTrak can be set into two modes: Standard Mode (Factory Mode): averages the shoe sensors together. These activity indicators will not change sensitivity with a change in system calibration. Shoe activity indicators (A and B) (shoe sensors averaged) and separator activity indicator (C) show the activity of each of the three sensors. Total loss activity indicator (D) shows the total hits from the three sensors. This total can be adjusted so that normal performance is shown mid scale. Optional Mode: shows activity of each individual shoe sensor (see your John Deere dealer). These activity indicators will not change sensitivity with a change in system calibration. Shoe activity indicators (A and B) (shoe sensors indicated independently) and separator activity indicator (C) show the activity of the three sensors. Total loss activity indicator (D) shows the total hits from the three sensors. This total can be adjusted so that normal performance is shown mid scale. Determine grain size of crop being harvested (refer to VisionTrak Performance Monitor- Operating in this section). |
|
OUO6075,0000618 -19-28MAR07-1/2 |
|
Adjust machine and header to acceptable loss levels for particular crop and condition. While operating at desired performance, push calibration button (E). This enters the current operating characteristics into memory and center total loss activity indicator. Calibration reference number (F) will also be shown for future reference. VisionTrak is now set up to help the operator maintain the machine's performance. NOTE: Center bar graph is now a visual guide. Operator can refer to display periodically to know when an increase or decrease in total loss amount occurs. A sudden upward movement of bar graphs when field conditions are unchanged, can indicate the chaffer or sieve is plugged or closed. When this happens, stop machine and correct the problem. |
OUO6075,0000618 -19-28MAR07-2/2 |
