SATELLITE INFORMATION softkey

Press: MENU button >> STARFIRE ITC button >> SATELLITE INFORMATION softkey.

The StarFire iTC - Satellite Information screen contains SKY PLOT and GRAPH tabs.

PC8663

MENU button

PC8659

STARFIRE ITC button

PC8682

SATELLITE INFORMATION softkey

JS56696,00005A8 -19-13MAY09-1/4
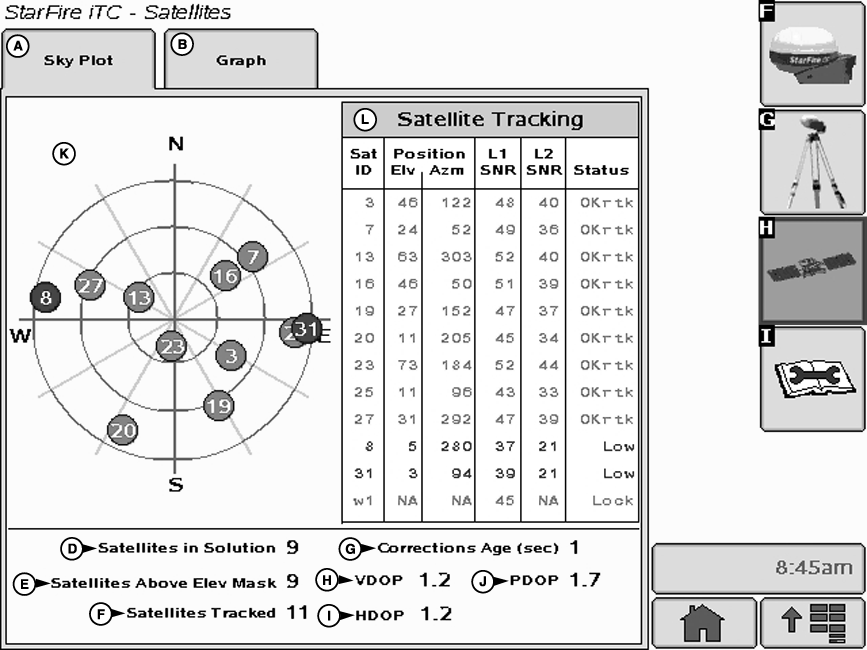

PC9711C


A-Sky Plot tab
B-Graph tab
D-Satellites in Solution


E-Satellites Above Elevation Mask
F-Satellites Tracked


G-Corrections Age
H-VDOP
I-HDOP


J-PDOP
K-Satellites on Sky Plot
L-Satellite Tracking

SKY PLOT tab

Illustrates where satellites are in relation to vehicles receiver. This allows operator to look at satellite geometry.

Reading Satellite Sky Plot

  • Sky Plot is fixed so that North is always at top.
  • Satellites are displayed as their satellite ID number that correspond to Satellite Tracking Chart located right of Sky Plot
    • Red › indicates satellite is in search mode
    • Blue › indicates satellite is being tracked
  • Green › indicates satellite is OK (being used for corrections)
  • Sky Plot consists of 3 concentric rings depicting 0, 30, and 60 degrees of elevation with directional crossbar intersection representing 90 degrees of elevation.
  • Grey radial lines extending from center of Sky Plot represent azimuth. They are spaced 30 degrees apart and represent 30 and 60 degrees.
  • Directional crossbar representing North, South, East, and West also represent azimuth at 0, 90, 180, and 270 degrees.
  • W1 and W2 (WAAS/EGNOS) satellites and inmarsat satellites are not shown in Sky Plot.
  • JS56696,00005A8 -19-13MAY09-2/4


    Satellite Tracking Chart
    • SAT ID › (Satellite Identification Number) Identification number for GPS Satellite.
    • ELV › (Position Elevation) Elevation in degrees above horizon for GPS satellite position
    • AZM › (Position Azimuth) Azimuth in degrees from true North for GPS satellite
    • L1 SNR › (L1 Signal to Noise Ratio) Signal strength for L1 GPS signal (signal to noise ratio)
    • L2 SNR › (L2 Signal to Noise Ratio) Signal strength for L2 GPS signal (signal to noise ratio)
    • Status › (GPS Signal Status) Status of GPS signal
      • Search › searching for satellite signal
      • Track › tracking satellite signal and using it for positioning
      • OK › tracking satellite signal and using it for positioning
      • OK SF1 › Tracking satellite signal and using it for positioning with STARFIRE single frequency
      • OK SF2 › Tracking satellite signal and using it for positioning with STARFIRE dual frequency
    Satellite Tracking Information

    Satellite Tracking information is displayed at bottom of SKY PLOT and GRAPH tabs.

    • Satellites in Solution › number of satellites used to compute position.
    • Satellites Above Elevation Mask › total number of GPS satellites available to receiver that are above 7 degree elevation mask.
    • Satellites Tracked › total number of GPS satellites tracked by receiver.
    • Corrections Age (sec) › age of differential correction signal to GPS (normally less than 10 seconds)
    • VDOP › Vertical Dilution of Precision
    • HDOP › Horizontal Dilution of Precision
    • PDOP › Positional Dilution of Precision is an indicator of GPS satellite geometry as viewed by receiver. A lower PDOP indicates better satellite geometry for calculating both horizontal and vertical position.

    JS56696,00005A8 -19-13MAY09-3/4
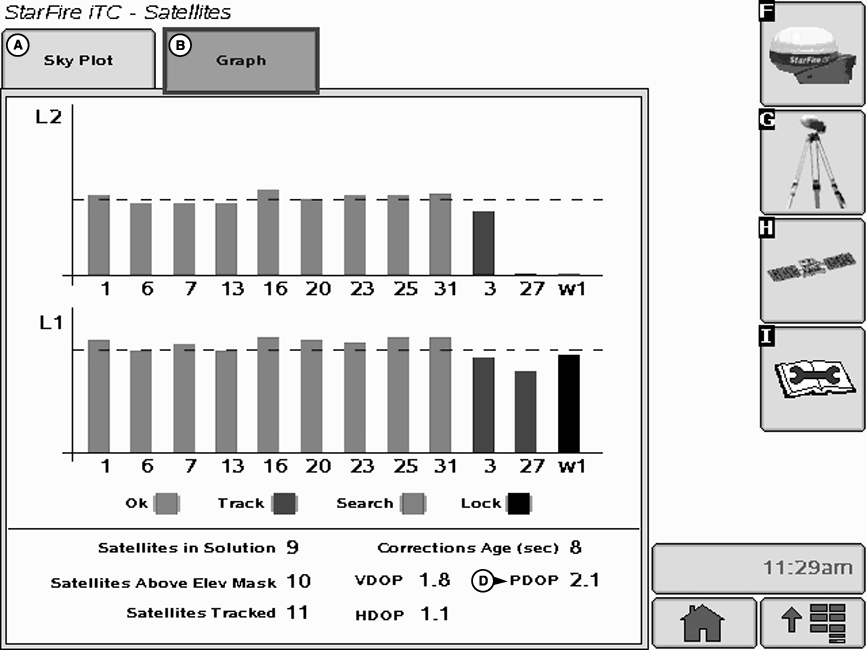

    PC9551C
     

    A-SkyPlot

    B-Graph

    D-PDOP

     
    Graph

    A graph illustrating L1 and L2 SNR values.

    • Bars are colored to satellites current status.
    • SNR values (colored bar) should be above dashed line that runs horizontally across bar graph.

    NOTE: ONLY GREEN bars are used in calculation of PDOP, VDOP, AND HDOP. SNR's are considered good if above dashed line.

    JS56696,00005A8 -19-13MAY09-4/4